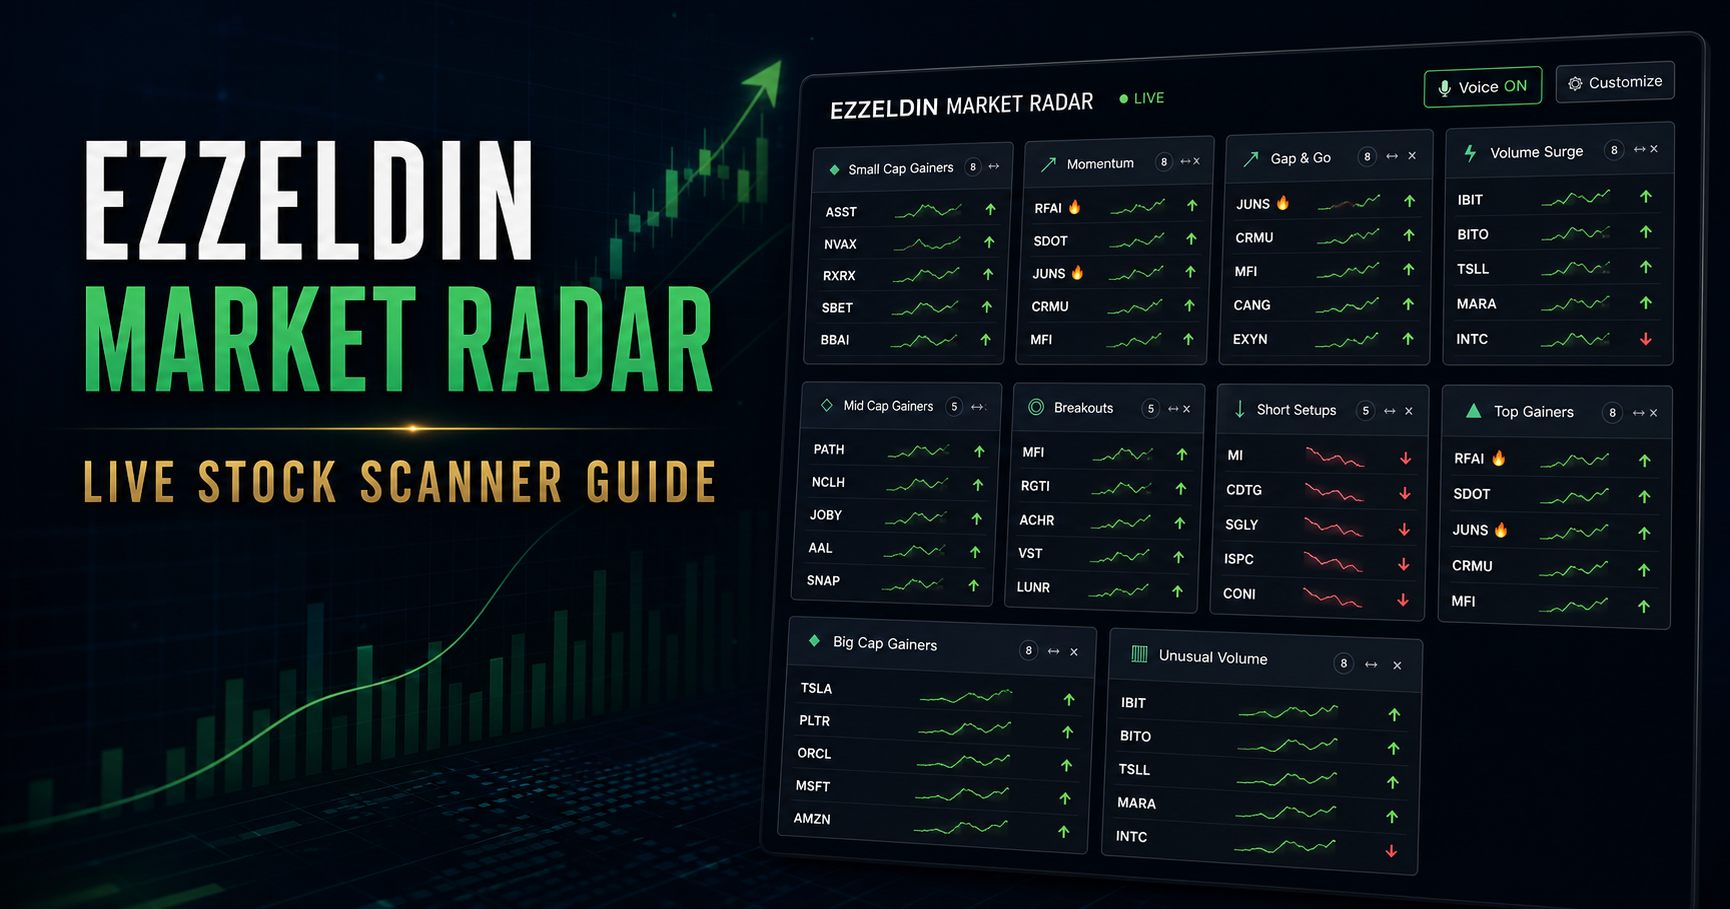
Ezzeldin Market Radar is a live, customizable stock-scanning dashboard built to help traders quickly organize fast-moving U.S. stocks. Instead of checking several disconnected screeners, the Radar places momentum stocks, gap-and-go candidates, breakouts, unusual volume, short setups, and market-cap gainers on one page.
Open Ezzeldin Market Radar to follow along with this guide.
What is Ezzeldin Market Radar?
Ezzeldin Market Radar is a browser-based stock market research tool powered by live Financial Modeling Prep market data and TradingView charts. The dashboard refreshes automatically and separates stocks into focused scanner widgets so users can compare different types of market activity without repeatedly changing pages.
The Radar is designed for idea generation and market monitoring. It does not tell users to buy or sell a stock. Instead, it helps narrow a large market into smaller lists that can be researched with charts, company news, risk controls, and a personal trading plan.
What each stock scanner shows
Momentum
The Momentum scanner highlights stocks making strong percentage moves during the current session. It can help identify where traders are concentrating attention, but a large percentage gain alone does not confirm that a move will continue.
Gap & Go
Gap & Go looks for stocks that opened at least 2% above the previous closing price and are still trading at or above today’s opening price. This is different from a stock that opened normally and moved higher later in the session.
Volume Surge and Unusual Volume
These widgets surface highly active symbols. Elevated volume can signal increased participation, news-driven interest, or rapid price discovery. Users should compare current volume with the stock’s normal trading activity and review the chart before making decisions.
Breakouts
The Breakouts scanner looks for positive stocks trading very close to their current intraday high. A symbol may appear because it is testing a key level, but traders should still check resistance, liquidity, spread, and whether volume supports the move.
Short Setups
Short Setups highlights stocks with negative price action that are trading at or below their opening price. This list is for identifying downside momentum—not an automatic short-sale recommendation. Short selling carries significant risk and requires careful position sizing.
Top Gainers
Top Gainers ranks the market’s strongest percentage advances. Because small companies can produce the largest percentage changes, this list may contain many volatile small and mid-cap stocks.
Small, Mid, and Big Cap Gainers
The Radar separates gaining stocks by company size so users can compare opportunities with different liquidity and volatility profiles:
- Small Cap Gainers: approximately $50 million to under $2 billion in market capitalization.
- Mid Cap Gainers: $2 billion to under $10 billion.
- Big Cap Gainers: $10 billion and above.
Small caps often move faster and can carry wider spreads and greater volatility. Big-cap stocks generally have deeper liquidity, while mid caps sit between the two. Separating them prevents the largest percentage movers from hiding important moves in companies such as NVIDIA, Palantir, Tesla, Alphabet, Apple, or other large-cap names when they qualify.
How to use the Radar step by step
- Start with the live status. Confirm the green LIVE indicator is visible before evaluating the results.
- Choose a scanner. Select the setup that matches your research goal: momentum, gaps, breakouts, volume, short setups, or a market-cap group.
- Click a ticker symbol. A quick candlestick chart opens without leaving the dashboard.
- Change the chart timeframe. Compare 1-minute, 5-minute, 15-minute, 1-hour, and daily views. A stock can look strong on one timeframe and extended or weak on another.
- Check today’s stock news. When a red fire icon appears beside a symbol, click it to expand today’s company-specific headlines.
- Use voice alerts. Voice alerts announce symbols when qualifying changes are detected. The matching ticker also flashes so it is easier to identify visually.
- Customize the workspace. Use Customize to hide, show, resize, or rearrange scanners, create a personal scanner, and add permanent chart widgets.
- Verify before acting. Review liquidity, spreads, support and resistance, news, broader market direction, and risk before considering a trade.
Create a custom stock scanner
The custom scanner builder lets users choose a name, direction, minimum and maximum price, minimum percentage change, minimum volume, sorting method, and number of results. For example, a user could build a $1–$10 gaining-stock scanner with a minimum volume requirement to focus on lower-priced stocks while excluding extremely illiquid names.
Custom layouts and scanners are saved on the user’s device, allowing the dashboard to become a personal stock-market workspace.
Understanding the quick charts
Click any ticker in a scanner widget to open its TradingView candlestick chart. The 1-minute and 5-minute views are useful for short-term price action, while the 15-minute and hourly views provide more context. The daily chart helps show major support, resistance, trend direction, and whether the current move is unusually extended.
No single timeframe should be used in isolation. A strong intraday candle can still be trading directly below major daily resistance.
Important limitations
Scanner results can change quickly, and market-data availability may depend on exchange reporting, provider entitlements, and normal refresh intervals. A scanner match is a starting point for research—not proof that a stock will continue moving.
Risk disclosure: Ezzeldin Market Radar is provided for informational and educational purposes only. It is not investment advice, a solicitation, or a recommendation to buy, sell, or short any security. Trading involves substantial risk, including the possible loss of principal.
Open the live stock scanner
Ready to explore the dashboard? Visit the Ezzeldin Market Radar page or open the full stock scanner.